Niharika's Blog
Food Nutrition Extraction,Analysis + EDA
By Niharika P, Mon 10 August 2020, in category Eda
By Niharika P, Mon 10 August 2020, in category Eda
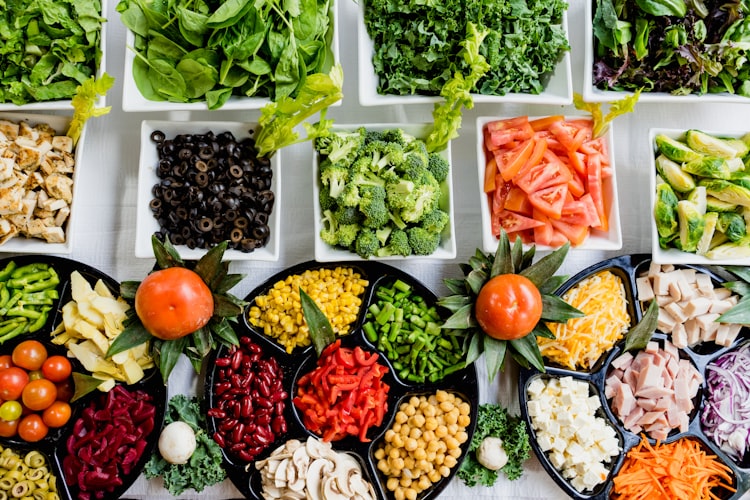
Food and nutrition are the way that we get fuel, providing energy for our bodies. We need to replace nutrients in our bodies with a new supply every day. Water is an important component of nutrition. Fats, proteins, and carbohydrates are all required.Nutrition is the science that interprets the nutrients and other substances in food in relation to maintenance, growth, reproduction, health and disease of an organism. It includes ingestion, absorption, assimilation, biosynthesis, catabolism and excretion.
Knowing and eating mindfully is not only essential for a healthy gut but also for peace of mind. Also,A diet filled with vegetables, fruits and whole grains could help prevent major conditions such as stroke, diabetes and heart disease.More often than not, we like to gorge on our favourite foods which are not exactly the best for our bodies.While it is okay for such binges to occur occasionally, such diets can be extremely harmful if the person does not strike a balance with healthy foods.
This notebook analyses the most common available foods and the nutritional facts in them.
import urllib.request
url = "https://en.wikipedia.org/wiki/Table_of_food_nutrients"
page = urllib.request.urlopen(url)
from bs4 import BeautifulSoup

soup = BeautifulSoup(page,"lxml")
food=[]
measure=[]
grams=[]
calories=[]
protein=[]
carb=[]
fiber=[]
fat=[]
sat_fat=[]
for row in soup.findAll('tr'):
    cells=row.findAll('td')
    if len(cells)==9:
        #print(cells)
        food.append(cells[0].find(text=True))
        #print(cells[0].find(text=True))
        measure.append(cells[1].find(text=True))
        grams.append(cells[2].find(text=True))
        calories.append(cells[3].find(text=True))
        protein.append(cells[4].find(text=True))
        carb.append(cells[5].find(text=True))
        fiber.append(cells[6].find(text=True))
        fat.append(cells[7].find(text=True))
        sat_fat.append(cells[8].find(text=True))
import pandas as pd
df=pd.DataFrame(food,columns=['Food'])
df['Measure']=measure
df['Grams']=grams
df['Calories']=calories
df['Protein']=protein
df['Fat']=fat
df['Sat.Fat']=sat_fat
df['Fiber']=fiber
df['Carbs']=carb

df.head()
After scraping, manually assigning categories(it is easier that way) for easy accessibility.
The dataset was then uploaded on Kaggle.
Data cleaning is always the first step in any data science project. Although the data here seems clean, some minor alterations are required.
import pandas as pd
import numpy as np
import plotly.express as px
import seaborn as sns
import plotly.offline as py
import plotly.graph_objects as go
nutrients=pd.read_csv("/kaggle/input/nutrition-details-for-most-common-foods/nutrients_csvfile.csv")
nutrients.head()
First things first, the t's in the data denote miniscule amounts so we might as well replace them by 0.
nutrients=nutrients.replace("t",0)
nutrients=nutrients.replace("t'",0)

nutrients.head()
Now, we need to remove all the expressions like commas from the dataset so as to convert the numerical data to the respective integer or float variables.
nutrients=nutrients.replace(",","", regex=True)
nutrients['Fiber']=nutrients['Fiber'].replace("a","", regex=True)
nutrients['Calories'][91]=(8+44)/2
Now, let us convert grams, calories, protein, fat, saturated fat, fiber and carbs datatypes to int.
nutrients['Grams']=pd.to_numeric(nutrients['Grams'])
nutrients['Calories']=pd.to_numeric(nutrients['Calories'])
nutrients['Protein']=pd.to_numeric(nutrients['Protein'])
nutrients['Fat']=pd.to_numeric(nutrients['Fat'])
nutrients['Sat.Fat']=pd.to_numeric(nutrients['Sat.Fat'])
nutrients['Fiber']=pd.to_numeric(nutrients['Fiber'])
nutrients['Carbs']=pd.to_numeric(nutrients['Carbs'])
nutrients.dtypes
Nice, all our data is in desired datatypes.
print(nutrients.isnull().any())
print('-'*245)
print(nutrients.describe())
print('-'*245)
There's a null value in the fiber column, lets drop that row entirely.
nutrients=nutrients.dropna()
nutrients.shape
Let's start the analysis by plotting the features with one another. This will not only provide us the distribution of features with one another but also give a quick quantitative feel of the data.
# Plotting the KDEplots

import matplotlib.pyplot as plt


f, axes = plt.subplots(2, 3, figsize=(10, 10), sharex=True, sharey=True)

s = np.linspace(0, 3, 10)
cmap = sns.cubehelix_palette(start=0.0, light=1, as_cmap=True)

sns.kdeplot(nutrients['Carbs'],nutrients['Protein'],cmap=cmap,shade=True, ax=axes[0,0])
axes[0,0].set(xlim=(-10, 50), ylim=(-30, 70), title = 'Carbs and Protein')

cmap = sns.cubehelix_palette(start=0.25, light=1, as_cmap=True)

sns.kdeplot(nutrients['Fat'],nutrients['Carbs'], ax=axes[0,1])
axes[0,1].set(xlim=(-10, 50), ylim=(-30, 70), title = 'Carbs and Fat')

cmap = sns.cubehelix_palette(start=0.33, light=1, as_cmap=True)

sns.kdeplot(nutrients['Carbs'],nutrients['Fiber'], ax=axes[0,2])
axes[0,2].set(xlim=(-10, 50), ylim=(-30, 70), title = 'Carbs and Fat')

cmap = sns.cubehelix_palette(start=0.45, light=1, as_cmap=True)

sns.kdeplot(nutrients['Fiber'],nutrients['Fat'], ax=axes[1,0])
axes[1,0].set(xlim=(-10, 50), ylim=(-30, 70), title = 'Fiber and Fat')

cmap = sns.cubehelix_palette(start=0.56, light=1, as_cmap=True)

sns.kdeplot(nutrients['Fat'],nutrients['Sat.Fat'], ax=axes[1,1])
axes[1,1].set(xlim=(-10, 50), ylim=(-30, 70), title = 'Sat. Fat and Fat')

cmap = sns.cubehelix_palette(start=0.68, light=1, as_cmap=True)

sns.kdeplot(nutrients['Carbs'],nutrients['Calories'], ax=axes[1,2])
axes[1,2].set(xlim=(-10, 100), ylim=(-30, 70), title = 'Calories and Carbs')

f.tight_layout()

What is the most protein rich food in the category of vegetables and grains?
alls=['Vegetables A-E',
 'Vegetables F-P',
 'Vegetables R-Z','Breads cereals fastfoodgrains','Seeds and Nuts']

prot= nutrients[nutrients['Category'].isin(alls)]

protein_rich= prot.sort_values(by='Protein', ascending= False)
top_20=protein_rich.head(20)
fig = px.bar(top_20, x='Food', y='Protein', color='Protein', title=' Top 10 protein rich foods')
fig.show()
Therefore, from the category of Grains, Vegetables and Seeds, whole wheat has the most protein content followed by white bread. Soybeans are also in the top 20s. Also, Almonds rank no. 1 in the Seeds category.🌱
What food has the most calories?
cals= nutrients.sort_values(by='Calories', ascending= False)
top_20_cals=cals.head(20)
fig = px.bar(top_20, x='Food', y='Calories' , color='Calories',title=' Top 10 calorie rich foods')
fig.show()
Fortified milk has the most calories, followed by white bread. Also, notice how whole wheat has the most proteins but has almost equal amount of calories. Lard is fat source with most calories and 1/2 cup of ice-creams tops the charts in the dessert category.
Normally, fat sources are often looked down upon. But, a certain amount of fat is required for a healthy gut. Let's look at some fatty foods.
fats= nutrients.sort_values(by='Fat', ascending= False)
top_20_fat=fats.head(20)
fig = px.bar(top_20_fat, x='Food', y='Calories', color='Calories', title=' Fat Content and Calories')
fig.show()
Therefore, Oysters and Butter have the largest combination of calories and fats, followed by lard.
Grouping the data into categories can give us the total count of all metrics and thus we can analyse the categories.
category_dist=nutrients.groupby(['Category']).sum()
category_dist
category_dist=nutrients.groupby(['Category']).sum()
from plotly.subplots import make_subplots
import plotly.graph_objects as go

fig = make_subplots(
    rows=2, cols=3,
    specs=[[{"type": "domain"},{"type": "domain"},{"type": "domain"}],[{"type": "domain"},{"type": "domain"},{"type": "domain"}]])

fig.add_trace(go.Pie(values=category_dist['Calories'].values, title='CALORIES', labels=category_dist.index,marker=dict(colors=['#100b','#f00560'], line=dict(color='#FFFFFF', width=2.5))),
              row=1, col=1)

fig.add_trace(go.Pie(values=category_dist['Fat'].values,title='FAT', labels=category_dist.index,marker=dict(colors=['#100b','#f00560'], line=dict(color='#FFFFFF', width=2.5))),
              row=1, col=2)

fig.add_trace(go.Pie(values=category_dist['Protein'].values,title='PROTEIN', labels=category_dist.index,marker=dict(colors=['#100b','#f00560'], line=dict(color='#FFFFFF', width=2.5))),
              row=1, col=3)

fig.add_trace(go.Pie(values=category_dist['Fiber'].values,title='FIBER', labels=category_dist.index,marker=dict(colors=['#100b','#f00560'], line=dict(color='#FFFFFF', width=2.5))),
              row=2, col=1)

fig.add_trace(go.Pie(values=category_dist['Sat.Fat'].values,title='SAT.FAT', labels=category_dist.index,marker=dict(colors=['#100b','#f00560'], line=dict(color='#FFFFFF', width=2.5))),
              row=2, col=2)

fig.add_trace(go.Pie(values=category_dist['Carbs'].values,title='CARBS', labels=category_dist.index,marker=dict(colors=['#100b','#f00560'], line=dict(color='#FFFFFF', width=2.5))),
              row=2, col=3)
fig.update_layout(title_text="Category wise distribution of all metrics",height=700, width=1000)

fig.show()
It is clear that breads, grains and cereals have the highest amount of Carbs and Calories.
Largest percentage of protein is in seafood (God bless the vegetarians!)
Surprisingly, same amount of fiber content is present in Fats and Seafood.
Seeds and nuts have about 14% fat content.
Fruits do not have a large percentage in any of the categories except carbs, they have about 10% carbohydrates.
Dairy products (15%) have more saturated fat content than seafood (11.8%).
Since it is clear that meat/ seafood have an abundance of protein, let us find the protein rich foods.
drinks= nutrients[nutrients['Category'].isin(['Fish Seafood','Desserts sweets'])]
drinks_top=drinks.sort_values(by='Calories', ascending= False)
drinks_top=drinks_top.head(10)

fig = go.Figure(go.Funnelarea(values=drinks_top['Calories'].values, text=drinks_top['Food'],
                              title = { "text": "Desserts with high calorie percentages"},
               marker = {"colors": ["deepskyblue", "lightsalmon", "tan", "teal", "silver","deepskyblue", "lightsalmon", "tan", "teal", "silver"],
                "line": {"color": ["wheat", "wheat", "blue", "wheat", "wheat","wheat", "wheat", "blue", "wheat", "wheat"]}}))


fig.show()
So, pudding has the most amount of calories followed by chocolate fudge.
drinks_fatty=drinks.sort_values(by='Fat', ascending= False)
drinks_fatty=drinks_fatty.head(10)

fig = go.Figure(go.Funnelarea(values=drinks_fatty['Fat'].values, text=drinks_fatty['Food'],
                              title = { "text": "Desserts with high fat percentage"},
               marker = {"colors": ["blue", "purple", "pink", "teal", "silver","yellow", "lightsalmon", "tan", "teal", "silver"],
                "line": {"color": ["wheat", "wheat", "blue", "wheat", "wheat","wheat", "wheat", "blue", "wheat", "wheat"]}}))
fig.show()
Pies and fudges have the highest percentage of fat as well.
meat= nutrients[nutrients['Category'].isin(['Fish Seafood','Meat Poultry'])]
meats_top=drinks.sort_values(by='Protein', ascending= False)
meats_top=meats_top.head(10)

fig = go.Figure(go.Pie(values=meats_top['Protein'].values, text=meats_top['Food'],
                              title = { "text": "Desserts with high calorie percentages"},
               marker = {"colors": ["maroon", "salmon", "tan", "gold", "silver","deepskyblue", "lightsalmon", "tan", "teal", "silver"],
                "line": {"color": ["wheat", "wheat", "blue", "wheat", "wheat","wheat", "wheat", "blue", "wheat", "wheat"]}}))
fig.show()
Oysters have a large amount of proteins, after them the flatfish flounders have about 6.59% protein.
top_10_fattest= meat.sort_values(by='Fat', ascending=False)
top_10_fattest=top_10_fattest.head(10)
fig = go.Figure(data=[go.Scatter(
    x=top_10_fattest['Food'], y=top_10_fattest['Fat'],
    mode='markers',
    marker_size=[200,180,160,140,120, 100 ,80 , 60 ,40,20])
])
fig.update_layout(title='Meat/Seafood with high Fat Content')
fig.show()
So, only have high protein as well as high fat percentage. Pork sausages are the second highest followed by Roast beef. Also, no type of fish is present in the top 10 fattiest meats list. So, fishes tend to have less fat, I suppose.
top_10_fibrous= meat.sort_values(by='Fiber', ascending=False)
top_10_fibrous=top_10_fibrous.head(10)
top_10_fibrous
Bacon, Halibut, Turkey and veal top the charts in terms of Fiber content.
3D scatter plots are used to plot data points on three axes in the attempt to show the relationship between three variables. Each row in the data table is represented by a marker whose position depends on its values in the columns set on the X, Y, and Z axes. Basically, Plotting some data on the z-axis of a normal x-y scatter plot like the previous figure.
They are interesting and though may not provide much inferences, are visually appealing to look at.
trace1 = go.Scatter3d(
    x=nutrients['Category'].values,
    y=nutrients['Food'].values,
    z=nutrients['Fat'].values,
    text=nutrients['Food'].values,
    mode='markers',
    marker=dict(
        sizemode='diameter',
         sizeref=750,
        color = nutrients['Fat'].values,
        colorscale = 'Portland',
        colorbar = dict(title = 'Total Fat (% Daily Value)'),
        line=dict(color='rgb(255, 255, 255)')
    )
)
data=[trace1]
layout=dict(height=800, width=800, title='3D Scatter Plot of Fatty foods (% Daily Value)')
fig=dict(data=data, layout=layout)
py.iplot(fig, filename='3DBubble')
trace1 = go.Scatter3d(
    x=nutrients['Category'].values,
    y=nutrients['Food'].values,
    z=nutrients['Carbs'].values,
    text=nutrients['Food'].values,
    mode='markers',
    marker=dict(
        sizemode='diameter',
         sizeref=750,
        color = nutrients['Carbs'].values,
        colorscale = 'Portland',
        colorbar = dict(title = 'Total Fat (% Daily Value)'),
        line=dict(color='rgb(255, 255, 255)')
    )
)
data=[trace1]
layout=dict(height=800, width=800, title='3D Scatter Plot of Carbohydrate rich food')
fig=dict(data=data, layout=layout)
py.iplot(fig, filename='3DBubble')
sns.set_style("whitegrid")
plt.figure(figsize=(22,10))
#plt.figure()

ax = sns.boxenplot(x="Category", y='Calories', data=nutrients, color='#eeeeee', palette="tab10")

# Add transparency to colors
for patch in ax.artists:
    r, g, b, a = patch.get_facecolor()
    patch.set_facecolor((r, g, b, .9))

#ax = sns.stripplot(x='Category', y='Cholesterol (% Daily Value)', data=menu, color="orange", jitter=0.5, size=5,alpha=0.15)
#
plt.title("Total Calorie Content \n", loc="center",size=32,color='#be0c0c',alpha=0.6)
plt.xlabel('Category',color='#34495E',fontsize=20)
plt.ylabel('Total Fat (% Daily Value)',color='#34495E',fontsize=20)
plt.xticks(size=16,color='#008abc',rotation=90, wrap=True)
plt.yticks(size=15,color='#006600')
#plt.text(2.5, 1, 'Courtesy: https://seaborn.pydata.org/examples/grouped_boxplot.html', fontsize=13,alpha=0.2)
#plt.ylim(0,200)
#plt.legend(loc="upper right",fontsize=14,ncol=5,title='Category',title_fontsize=22,framealpha=0.99)
plt.show()